


Capitalize on Analytics & KPI maturity strengths in 2026
Walk into almost any modern manufacturing organization today, and you’ll hear the same concerns echoing across conference rooms and leadership meetings.
A manufacturer invests heavily in a new eCommerce platform.
They add integrations, upgrade hosting, redesign product pages, and pour budget into marketing.
Months pass… yet growth barely moves.
Site speed is inconsistent.
RFQs fluctuate without explanation.
Lead quality is unpredictable.
Conversion rates stall.
And despite all the tools plugged into their stack, no one can clearly answer the most important question:
“What exactly is driving our growth… and why aren’t we growing faster?”
This is the reality for many manufacturers expanding their digital presence. Unlike retail brands, manufacturers deal with complex catalogs, legacy systems, distributor relationships, long buying cycles, and technical buyers who expect instant clarity and reliability.
Small inefficiencies like slow product pages, poor search visibility, unclear buyer journeys, or scattered analytic, quickly compound into lost revenue.
What manufacturers truly need isn’t another platform, plugin, or ad campaign.
They need a measurable, predictable growth system that cuts through the noise, eliminates guesswork, and proves impact with real numbers.
In the next sections, we’ll explore how this program works, why it was designed, and what makes the 90-day metric guarantee so powerful for industrial and B2B manufacturers.
The Manufacturing Growth Gap in 2026

Why Digital Growth Stalls for Manufacturers
- Slow or inconsistent site speed
- Unpredictable lead quality
- Fluctuating RFQs
- Low conversion rates
- Poor catalog visibility
- Scattered analytics and unclear KPIs
The Core Question Every Manufacturer Asks:
“What exactly is driving our growth… and why aren’t we growing faster?”
Why Manufacturers Need a Structured, Metric-Led Growth Program
Manufacturers are operating in one of the most challenging digital environments today. While the shift from traditional sales cycles to online discovery, research, and purchasing continues to accelerate, most manufacturing organizations still struggle to generate predictable results from their eCommerce ecosystem. The reason is clarity.
Unlike consumer brands, manufacturers deal with:
- Complex product catalogs
- Highly technical buyers
- Distributor and dealer networks
- Custom quoting processes (RFQs)
- Long sales cycles
- Non-standard customer journeys
This makes digital growth fundamentally different for industrial businesses. Success depends not just on traffic or aesthetics, but on the interplay of speed, search visibility, product data quality, buyer experience, and analytics-driven decision-making.
Yet in many organizations, these components operate in silos.
Marketing teams run campaigns.
IT teams manage platforms.
Sales teams handle RFQs.
Operations teams manage inventory and fulfillment.
Everyone is working hard but not always toward the same measurable outcome.
The Unique Challenges of Manufacturing eCommerce
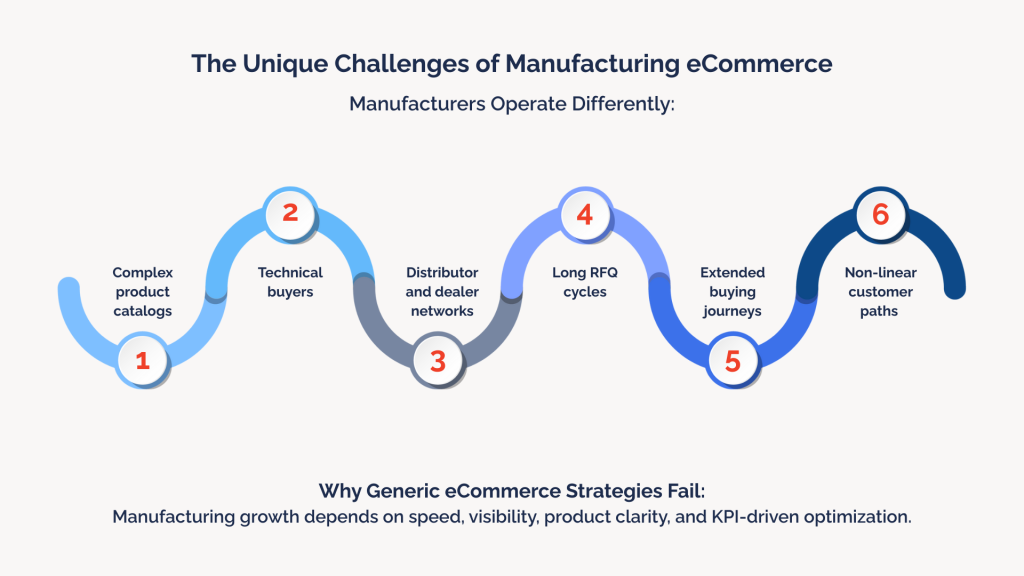
Manufacturers Operate Differently:
- Complex product catalogs
- Technical buyers
- Distributor and dealer networks
- Long RFQ cycles
- Extended buying journeys
- Non-linear customer paths
Why Generic eCommerce Strategies Fail:
Manufacturing growth depends on speed, visibility, product clarity, and KPI-driven optimization.
The Missing Ingredient: A Defined Growth System
Most manufacturers eventually discover the same truth:
Growth doesn’t fail because of lack of effort.
It fails because no one is measuring the right things.
Without structured KPIs, unified reporting, and a framework for continuous optimization, even the most expensive digital investments can stagnate. Manufacturers need a system that ties every improvement like site changes, performance enhancements, CRO experiments, content updates, or marketing spend, back to measurable KPIs.
That system must:
- Establish a clear baseline
- Define growth targets
- Measure the correct metrics
- Execute improvements in rapid cycles
- Show proof of impact within a defined window
This is why a metric-led, time-bound program becomes essential. Manufacturers don’t want vague commitments like “improve conversions” or “increase visibility.” They want defined outcomes tied to speed, lead volume, conversion lifts, RFQs, and buyer engagement.
They want proof, not assumptions.
And that is exactly what the new GrowthX for Manufacturing: 90 Days to Proof™ is designed to deliver.
What Manufacturers Usually Get vs. What They Actually Need

What They Usually Get:
- More tools
- More campaigns
- More plugins
- More redesigns
What They Actually Need:
- A structured KPI-led system
- Clear baselines
- Defined growth targets
- Rapid improvement cycles
- Measurable proof
Introducing “GrowthX for Manufacturing: 90 Days to Proof™”
After years of working with manufacturers across industrial, automotive, engineering, OEM, and distribution sectors, one insight has become clear: growth becomes predictable only when it follows a defined framework with measurable checkpoints. GrowthX is originally built to bring this structure to eCommerce to solve the unique challenges of eCommerce businesses.
GrowthX for Manufacturing — 90 Days to Proof™ is a productized, outcome-driven program that gives manufacturers a crystal-clear roadmap for measurable growth. It’s built on Wagento’s proven analytics maturity, KPI discipline, and GrowthX methodology but optimized with a new layer of precision, accountability, and speed.
This program does not operate like a typical consulting engagement. It functions like a performance engine, delivering specific improvements across technical, operational, and marketing dimensions within a fixed timeline.
Here’s the core purpose of the program:
Define a “GrowthX for Manufacturing: 90 Days to Proof” program with fixed deliverables and target metrics such as speed index reductions, lead volume increases, and conversion lift ranges.
These are measurable commitments backed by manufacturing-specific benchmarking and data insights. The 90-day structure ensures momentum, eliminates long delays, and provides leadership with tangible results they can evaluate and build on.

A Productized Growth Program Built for Manufacturers
- Fixed deliverables
- Defined timeline
- KPI-driven execution
- Measurable outcomes
- Data-backed improvements
Core Promise:
See measurable improvements in 90 days — backed by real analytics.
What Makes the Program Productized?
Unlike open-ended growth engagements, this version of GrowthX is designed with:
- A fixed scope
- A defined timeline
- A standardized measurement framework
- A clear set of deliverables
- A consistent focus on target KPIs
This makes the program easier for manufacturers to understand, justify, present internally, and repeat.
The 90-Day Metric Guarantee
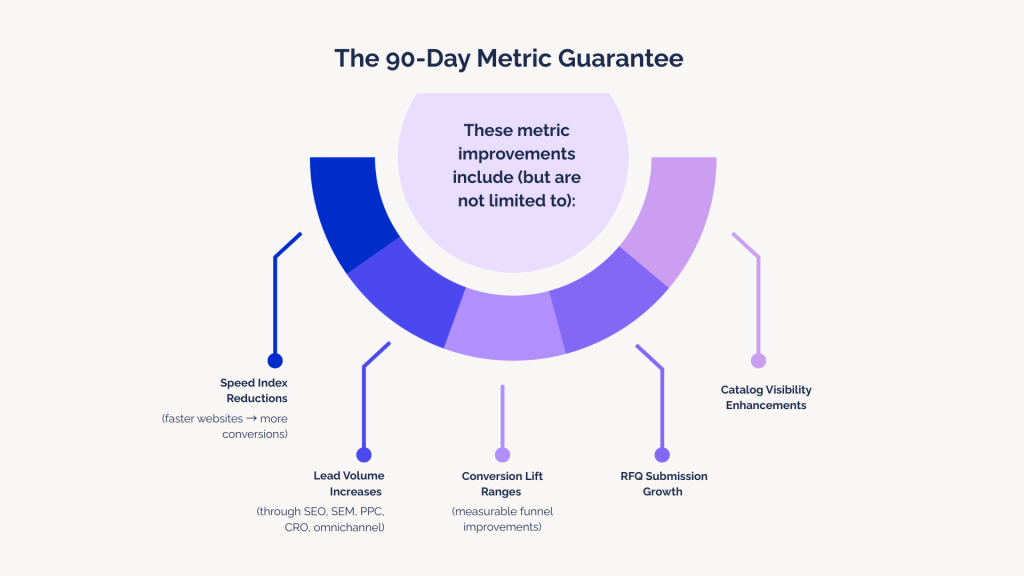
The 90-Day Guarantee is the heart of the program. It ensures that manufacturers will see measurable improvements in defined KPIs, not “eventually” or “over time,” but within 90 days.
These metric improvements include (but are not limited to):
- Speed Index Reductions (faster websites → more conversions)
- Lead Volume Increases (through SEO, SEM, PPC, CRO, omnichannel)
- Conversion Lift Ranges (measurable funnel improvements)
- RFQ Submission Growth
- Catalog Visibility Enhancements
By pre-defining these measurable metrics, manufacturers gain confidence, and internal teams gain clarity. Every improvement ties directly back to a committed KPI.
The next sections will explore how this program is built, how metrics are measured, and how two real-world scenarios demonstrate the impact of the 90-Day Proof model.
The GrowthX Framework Behind the 90-Day Manufacturing Program
To understand why the 90-day metric guarantee is possible and why it works particularly well for manufacturers, it’s important to look at the foundation powering it: the GrowthX framework.
At its core, GrowthX is powered by the G.R.O.W.T.H. methodology, a six-pillar system that organizes digital acceleration into predictable, interconnected layers. Each pillar influences measurable performance outcomes — making it the ideal engine behind a guaranteed 90-day program.
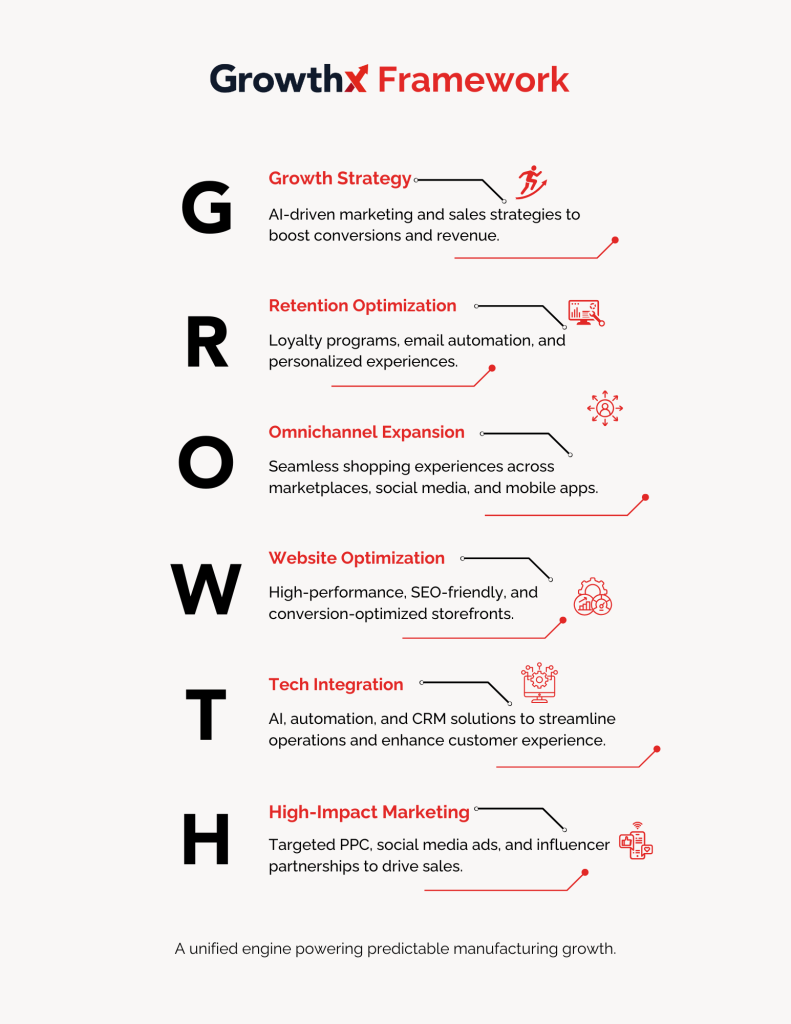
The Six Pillars:
- Growth Strategy
- Retention Optimization
- Omnichannel Expansion
- Website Optimization
- Tech Integration
- High-Impact Marketing
A unified engine powering predictable manufacturing growth.
Growth Strategy – Directed, AI-Driven Revenue Acceleration
GrowthX begins with a strategic foundation, ensuring that manufacturers operate with precise ICP targeting, segmented user journeys, and a roadmap built on data rather than assumptions. This creates a clear direction for how traffic, revenue, and engagement should grow.
Retention Optimization – Turning One-Time Buyers Into Long-Term Partners
Manufacturing growth is not just about acquisition. GrowthX uses automation, personalization, and retention modeling to strengthen repeat orders, re-engagement, and long-term customer value — critical for B2B relationships.
Omnichannel Expansion – Meeting Buyers Wherever They Research & Purchase
Industrial buyers often begin research on Google, compare on marketplaces, validate through distributors, and only then approach manufacturers. The GrowthX framework aligns all these touchpoints, ensuring consistency and visibility across marketplaces, social channels, and mobile experiences.
Website Optimization – The Engine of Digital Conversion
Manufacturers often underestimate the importance of high-performance storefronts. GrowthX integrates CRO, SEO, UX/UI enhancements, and speed engineering to transform the website into a frictionless, conversion-ready environment — a prerequisite for achieving measurable lifts in the 90-day program.
Tech Integration — Streamlined Systems for a Better Buyer Experience
Many manufacturers rely on complex infrastructures: ERP systems, inventory tools, distributor portals, product information systems, and more. GrowthX incorporates AI, automation, CRM integration, and backend improvements to eliminate inefficiencies and ensure seamless operations.
High-Impact Marketing — Driving Growth With Precision and Efficiency
Manufacturing buyers are analytical and technical. GrowthX’s marketing approach focuses on performance-driven advertising, search visibility, and targeted campaigns that bring qualified leads — not vanity traffic.
Together, these six pillars form a unified growth engine — one that tracks measurable KPIs, improves performance across multiple touchpoints, and directly supports the “90 Days to Proof™” execution model.
Instead of isolated improvements, manufacturers receive a synchronized transformation built from the inside out, backed by the same GrowthX methodology that has consistently delivered accelerated performance across industries.
In the next section, we go deeper into how these improvements are measured — and how the measurement blueprint ensures transparent, verifiable results for every manufacturer enrolled in the program.
The Measurement Blueprint for Manufacturers

What it includes:
- Unified data sources
- KPI definitions
- Tracking rules
- Governance standards
- Weekly performance reviews
- Final proof reporting
Outcome:
A single source of truth for manufacturing growth.
One of the biggest challenges manufacturers face is the lack of meaningful, connected, and actionable data.
Manufacturing organizations often have analytics scattered across platforms, incomplete tracking, unclear KPIs, or dashboards that don’t communicate what’s actually driving growth.
Without a unified measurement approach, even the strongest execution effort can become diluted.
This is why GrowthX for Manufacturing — 90 Days to Proof™ includes a dedicated Measurement Blueprint, a structured system that outlines what will be measured, how it will be measured, and how each metric contributes to the final performance results.
This aligns directly with one of the central design recommendations for this new productized program:
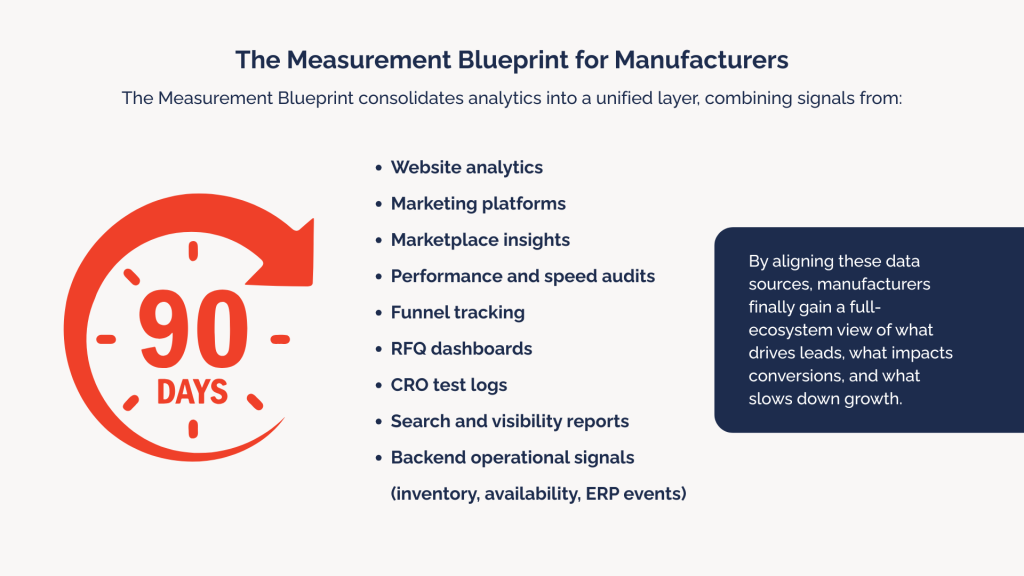
A Single Source of Truth for Manufacturing Growth
The Measurement Blueprint consolidates analytics into a unified layer, combining signals from:
- Website analytics
- Marketing platforms
- Marketplace insights
- Performance and speed audits
- Funnel tracking
- RFQ dashboards
- CRO test logs
- Search and visibility reports
- Backend operational signals (inventory, availability, ERP events)
By aligning these data sources, manufacturers finally gain a full-ecosystem view of what drives leads, what impacts conversions, and what slows down growth.
Clear KPI Governance
GrowthX’s measurement blueprint defines KPI governance — the rules, ownership, and thresholds for each metric. Every KPI is documented, including:
- What the metric means
- How it’s calculated
- What tools validate it
- What benchmarks apply for manufacturing
- Who is responsible for each data source
- What “acceptable lift” means within 90 days
This ensures accuracy, consistency, and full visibility for internal leadership.

A Transparent, Verifiable Tracking Process
To ensure absolute clarity, accountability, and measurable impact, every manufacturer enrolled in the program follows a structured reporting cycle that makes progress visible at every stage of the 90 days.
Each manufacturer participating in the program receives:
1. A Baseline Report
A comprehensive diagnostic covering speed index, search visibility, conversion rates, RFQ performance, user behavior, catalog interactions, and funnel efficiency. This establishes the benchmark against which all improvements will be measured.
2. Weekly KPI Progress Updates
Through a real-time shared dashboard, manufacturers see incremental improvements, emerging opportunities, and upcoming actions. These weekly insights ensure momentum and allow rapid course correction when needed.
3. The 30–30–30 Reporting Rule (Image)
GrowthX for Manufacturing operates on a structured three-checkpoint model within the 90-day period:
- Day 30 Review — Foundation Alignment
- Day 60 Review — Performance Acceleration
- Day 90 Review — Proof Delivery
Final KPI outcomes measured against the baseline, showing clear deltas for all priority metrics.
This 30–30–30 structure ensures transparency and gives manufacturers tangible proof of momentum throughout the program—not just at the end.
4. A Structured Measurement Roadmap (Image from Canva deck)
A documented plan showing what will be improved, why it matters, and which KPIs each action is tied to. This roadmap creates alignment between technical teams, marketing teams, sales teams, and leadership.
5. The Final “90-Day Proof Report™”
A rigorous before-and-after analysis presenting every improvement achieved within the 90-day window.
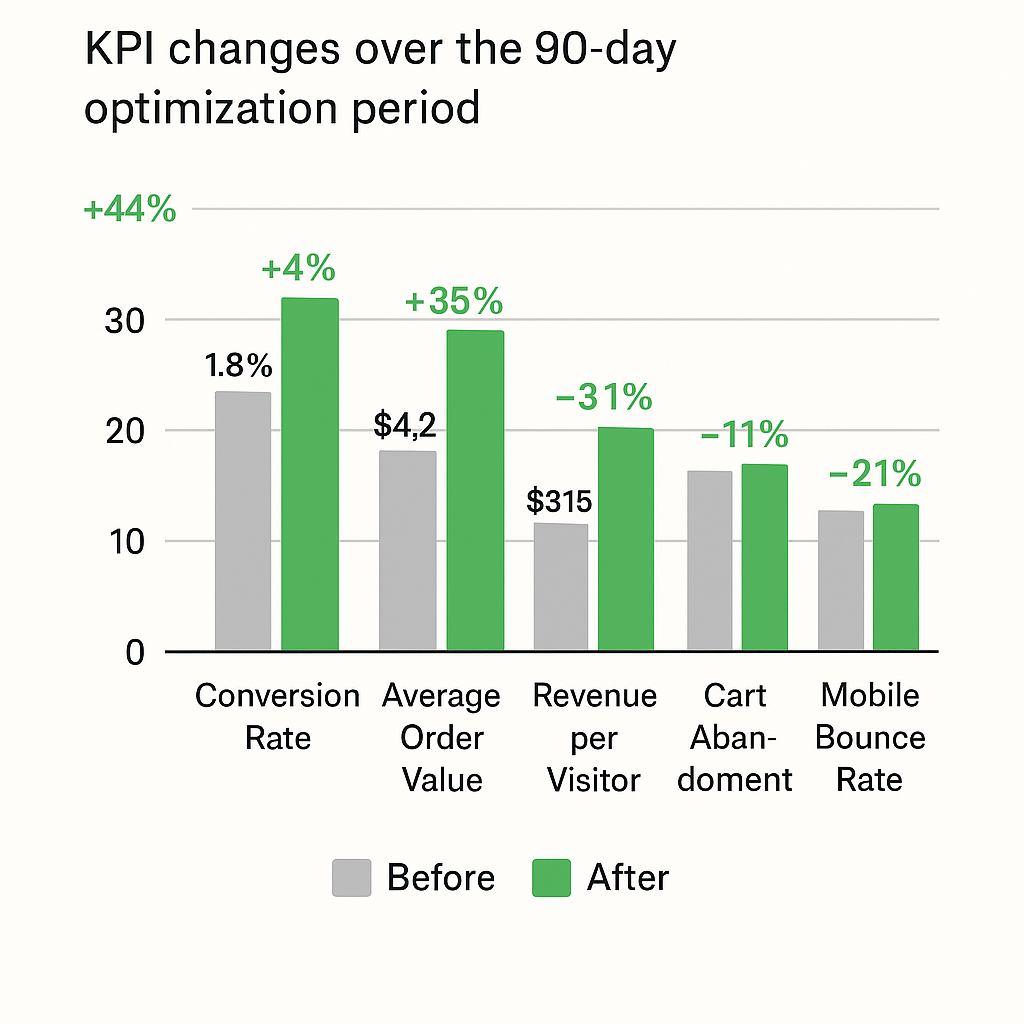
1. KPI Deltas (Before vs After)
Scenario:
In the 90-day optimization period, your store’s key KPIs shifted as follows:
- Conversion Rate: 1.8% → 2.6% (+44%)
- Average Order Value: $68 → $74 (+9%)
- Revenue per Visitor: $3.10 → $4.20 (+35%)
- Cart Abandonment: 71% → 63% (-11%)
- Mobile Bounce Rate: 58% → 46% (-21%)
2. Speed Index Shifts
Scenario:
Page performance accelerated significantly following code optimization and media compression:
- Homepage Speed Index: 4.9s → 2.8s (42% faster)
- Product Page Speed Index: 5.6s → 3.4s (39% faster)
- Checkout Speed Index: 4.2s → 2.5s (40% faster)
3. Conversion Lift Ranges
Scenario:
Based on A/B testing, UX improvements, and checkout simplification:
- Product Page Conversion Lift: +12–18%
- Add-to-Cart Lift: +15–22%
- Checkout Completion Lift: +8–14%
- Mobile Conversion Lift: +20–27%
4. Lead Volume Growth
Scenario:
After optimizing the lead capture journey and implementing new CTAs:
- Leads in Previous 90 Days: 1,450
- Leads in Optimized 90 Days: 2,180
- Growth: +50%
Additional uplift sources:
- New gated resources: +320 leads
- Exit-intent popup: +210 leads
- Mobile-optimized form: +200 leads
5. Search & Visibility Improvements
Scenario:
SEO and on-site relevance enhancements resulted in:
- Ranking Keywords (Top 10): 85 → 142 (+67%)
- Impressions: 210,000 → 340,000 (+62%)
- Organic Clicks: 9,500 → 14,800 (+56%)
- Non-branded traffic share: 38% → 51%
Category improvements example:
- “Industrial Tools” category moved from avg rank 22 → 11
- “Safety Accessories” moved 34 → 18
6. RFQ (Request for Quote) Submission Changes
Scenario:
Following improvements in the RFQ workflow, pricing visibility, and form UX:
- RFQ Submissions Before: 310
- RFQ Submissions After: 485
- Growth: +56%
Additional impact insights:
- Simplified RFQ form reduced abandonment by 28%
- Mobile RFQ submissions increased by 70%
- Adding “Request Bulk Pricing” button on product pages contributed +110 RFQs
This is the moment where the program fulfills its promise: measurable improvements within 90 days, supported by verifiable data — not assumptions.
How the Blueprint Drives Confidence
For manufacturers, this blueprint creates:
Full transparency – Clear visibility into every optimization, metric shift, and outcome.
Predictability – Proven processes and data-backed forecasting eliminate guesswork.
Repeatability – Standardized workflows turn wins into scalable, repeatable success.
Clear ROI justification – Every action ties directly to measurable KPIs and revenue impact.
Executive-friendly reporting – Simple visuals and concise summaries make insights decision-ready.
It eliminates the ambiguity often associated with digital growth efforts and replaces it with a governed framework that can be communicated internally, audited externally, and scaled over time.
In the next section, we bring this framework to life with two short, metric-dense case synopses that demonstrate what the 90-Day Proof model can achieve.
How the Monthly Timeline Fits Into the 30–30–30 Structure
The GrowthX for Manufacturing — 90 Days to Proof™ program is built around a very deliberate execution rhythm. The 30–30–30 model ensures that every month (every 30-day cycle) delivers visible progress, measurable improvements, and aligned actions across strategy, campaigns, outreach, and optimization.
The 30–30–30 Timeline
Days 1–30 — Foundation & Alignment
- Tools setup
- Baseline KPIs
- Strategy buildout
- Early campaigns
Days 31–60 — Acceleration & Optimization
- Full campaign rollout
- CRO improvements
- Visibility lifts
- Mid-cycle adjustments
Days 61–90 — Proof, Scaling & Handover
- High-intent optimization
- Lead quality improvements
- Final KPI shifts
- 90-Day Proof Report
Here’s how it translates into the 30–30–30 format:
🟦 Days 1–30: Foundation, Setup & Strategic Alignment (First 30)
This phase focuses on building the engine before we accelerate.
From the timeline in the image:
1. Tools Access & Setup
All analytics, CRM, email, marketing, and tracking systems are aligned, connected, and validated.
2. Client Intake
We gather product information, ICP details, sales goals, technical insights, catalogs, and existing challenges.
3. Insights & Recommendations
A diagnostic analysis is completed — combining audits, speed performance, visibility gaps, RFQ patterns, and UX issues.
4. Digital Strategy Buildout
A 90-day strategic plan is created and approved.
5. Campaign Management Begins (Interest Stage)
- Organic campaigns
- Email (Interest)
- LinkedIn outreach
- CRM nurture paths
- Tracking & reporting foundations
Outcome of Days 1–30:
The groundwork is set, systems are connected, KPIs are baselined, and initial performance improvements start to appear (speed, visibility, engagement).
🟦 Days 31–60: Execution, Acceleration & Channel Expansion (Second 30)
This phase moves from foundation → acceleration.
From the timeline in the image:
1. Rollout of Active Campaigns
Paid campaigns, attention-stage email flows, LinkedIn outreach, and CRM nurture sequences go live.
2. Desire Stage Targeting
- Paid campaigns optimized
- Email (Desire) launched
- Organic + paid synergy created
- CRM nurtures intensified
- Technical CRO fixes deployed
3. Tracking, Reporting & Optimization
Daily, weekly, and mid-cycle improvements are implemented based on performance signals.
Outcome of Days 31–60:
Meaningful lifts begin to show in lead quality, RFQs, product-page engagement, and catalog visibility.
🟦 Days 61–90: Proof, Scaling & Handover (Final 30)
The final 30 days focus on measurable KPI lifts and implementing improvements that complete the Proof cycle.
From the timeline in the image:
1. Action Stage Campaigns
- High-intent paid campaigns
- Email (Action stage)
- LinkedIn + CRM automation
- CRO refinements
- RFQ pathways optimized
2. Review & Organic Extensions
Campaigns are expanded or adjusted based on results from the first 60 days.
3. Paid Extensions & Final Tracking
Paid campaigns scale based on high-performing segments or keywords.
4. Leads Handover & Final Reporting Setup
Sales and marketing teams receive structured lead insights + CRM mapping.
5. Final “90-Day Proof Report™”
Documented KPI improvements in:
- Speed index
- Lead volume
- Conversion lift ranges
- RFQ submissions
- Catalog visibility
- Funnel performance
Outcome of Days 61–90:
The manufacturer receives a complete before-and-after transformation with proven metrics and a roadmap for the next growth phase.
💡 Summary Table: 30–30–30 Explained Through the Monthly Timeline
| Period | What Happens | Purpose |
| Days 1–30 | Setup, Strategy, Baseline, Early Campaigns | Build the engine + fix foundational gaps |
| Days 31–60 | Full rollout, acceleration, multi-channel expansion | Drive measurable performance improvements |
| Days 61–90 | Scaling, optimization, proof documentation, handover | Deliver final KPI improvements + Proof Report |
Case Studies
Final Thoughts
Manufacturers rarely get the benefit of fast, predictable, and measurable digital growth programs.
Most solutions on the market offer fragmented improvements — a faster website here, a campaign boost there, or isolated CRO fixes that don’t connect to a bigger picture.
But manufacturing growth doesn’t work in fragments. It needs structure, clarity, and proof.
GrowthX for Manufacturing — 90 Days to Proof™ brings all of those elements together into one unified, productized program. It transforms digital growth from a vague ambition into a measurable, timeline-driven process with clear deliverables and defined KPIs.
By aligning performance, analytics, optimization, and execution inside a 30–30–30 framework, manufacturers finally get what they’ve always needed: a system they can trust.
This is more than a framework — it’s a new way forward for industrial businesses.
A way to unlock visibility.
A way to accelerate revenue.
A way to turn data into action and action into proof.
As manufacturers continue to evolve their digital ecosystems, this program offers a simple and powerful promise:
Give us 90 days, and we’ll show you the numbers that prove your business can grow.
Before & After — 90-Day GrowthX Program
Before GrowthX:
- Slow product pages
- Dropping RFQs
- Weak catalog visibility
- Low engagement
- Stagnant conversions
After 90 Days:
- Speed Index improved by 20–30%
- Leads increased by 30–40%
- Conversion lift of 10–15%
- RFQs up by 15–25%
- Catalog visibility improved significantly